
Lesson 04
Two Types of Business Intelligence
Compare Enterprise BI and Self-Service BI: governance, dimensional modeling, and how each approach fits different data teams and needs.
Two Types of Business Intelligence
Enterprise BI vs Self-Service BI, governance, dimensional modeling.
Two types of BI
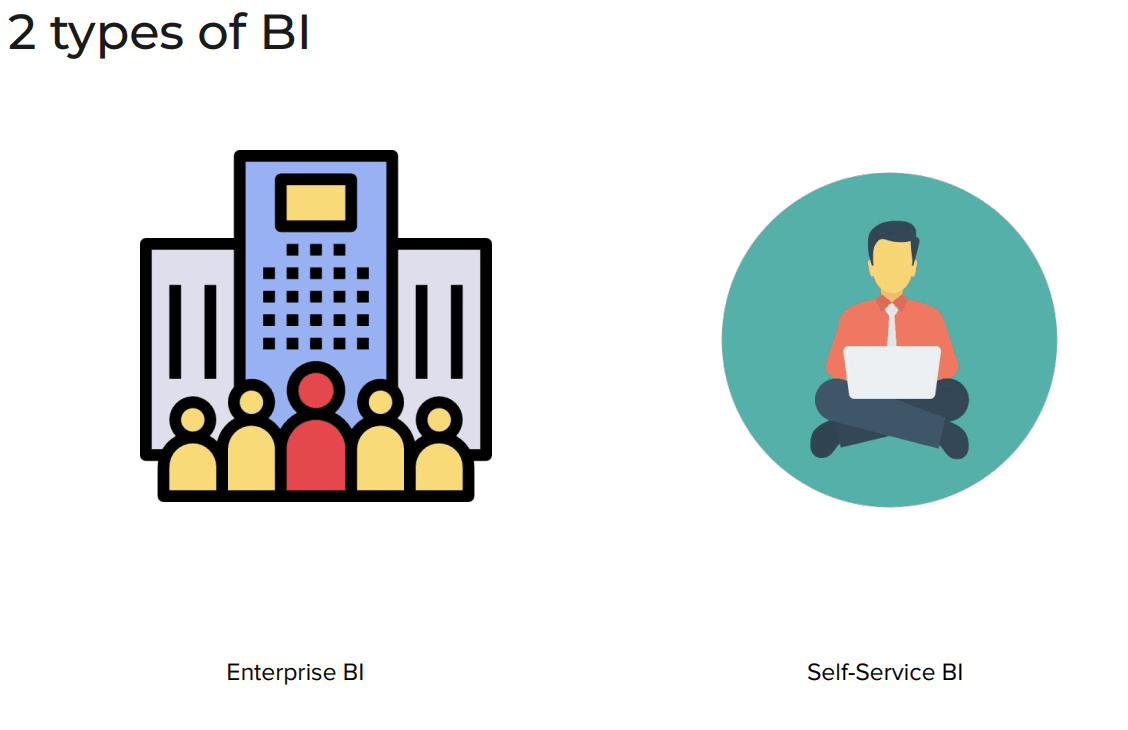
Business Intelligence tools fall into two camps:
- Enterprise BI: IT-managed and centralized. A team of BI developers builds one shared data model, and the whole company reports from it.
- Self-Service BI: analyst-driven. Business users connect to data and build their own reports and dashboards, without waiting for IT.
Most companies end up with a mix of both, but knowing which approach a tool was built for tells you a lot about how it is used and who maintains it.
Enterprise BI
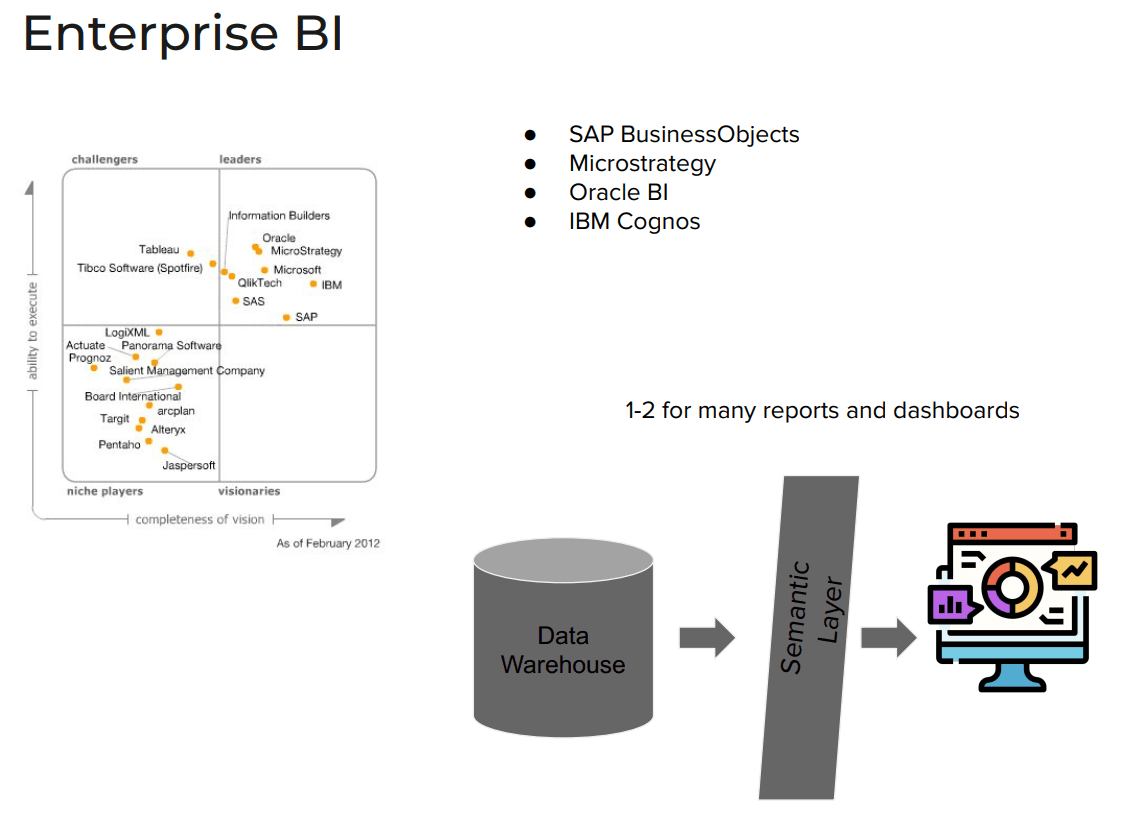
Classic Enterprise BI platforms:
- SAP BusinessObjects
- MicroStrategy
- Oracle BI
- IBM Cognos
The architecture is Data Warehouse → Semantic Layer → reports and dashboards. The semantic layer translates warehouse tables into business terms (customer, revenue, region), so every report reads from the same definitions. A company usually has one or two semantic layers feeding many reports and dashboards.
The Gartner Magic Quadrant from February 2012 shows the era when these vendors led the BI market. Tableau and Qlik were still challengers.
SAP BusinessObjects Universe
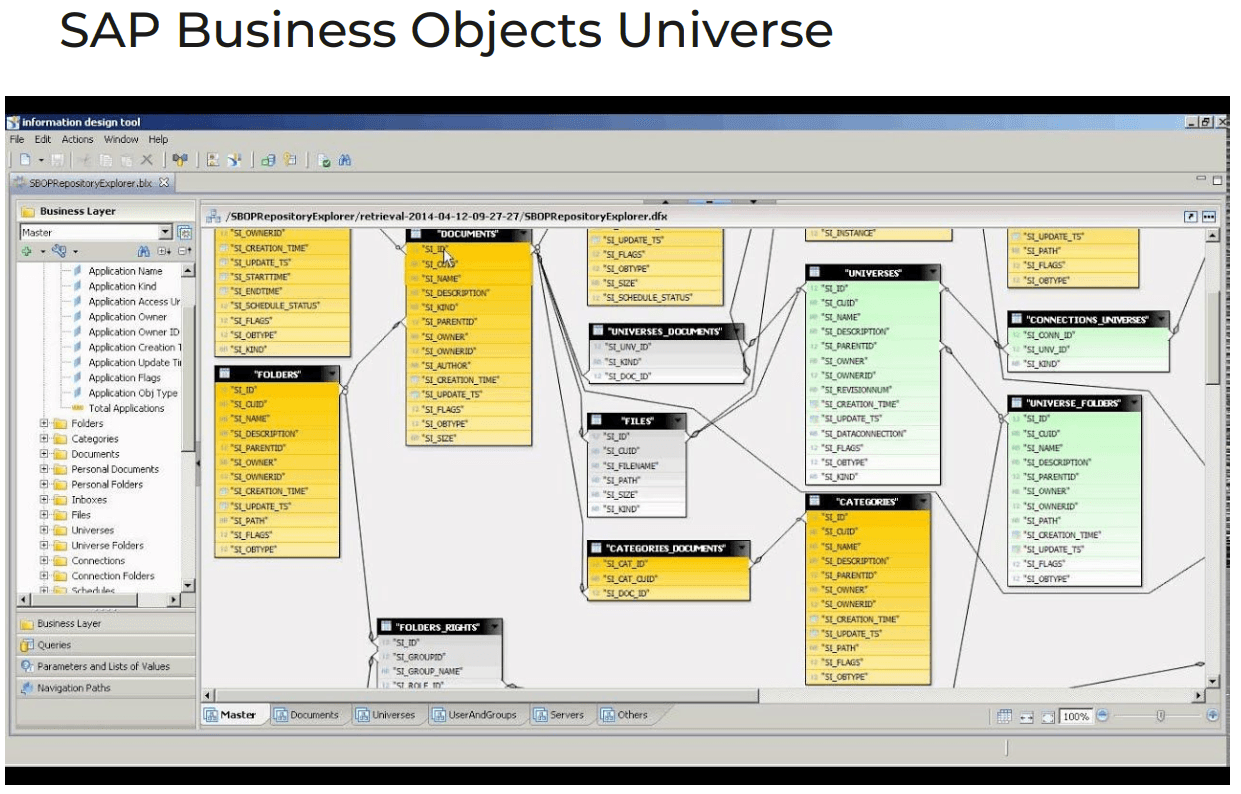
In SAP BusinessObjects, the semantic layer is called a Universe. BI developers build it in the Information Design Tool: they pick the warehouse tables, define the joins between them, and expose business-friendly objects (dimensions and measures) to report users.
Report users never see the SQL or the joins. They drag objects from the Universe, and BusinessObjects generates the query. That is what keeps numbers consistent across the company, and also why every change has to go through a BI developer.
Self-Service BI
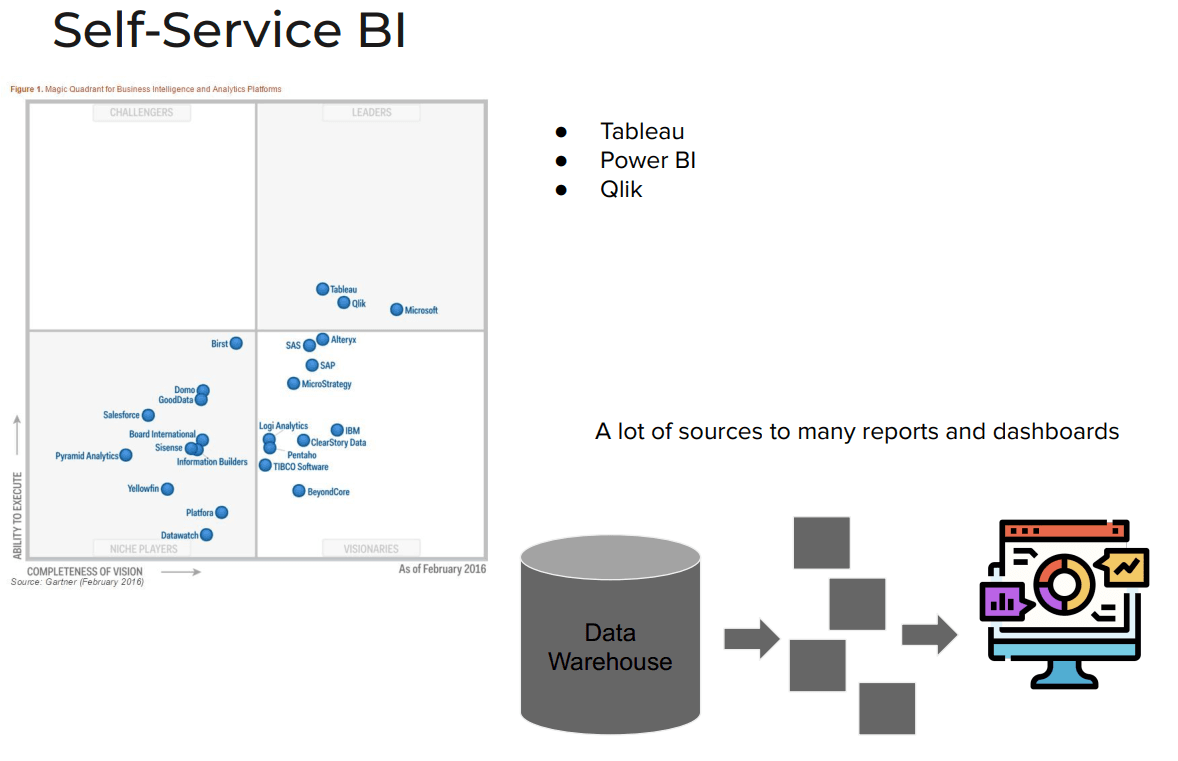
Leading Self-Service BI tools:
- Tableau
- Power BI
- Qlik
Here there is no single governed layer: analysts connect to many sources (the warehouse, spreadsheets, files, SaaS apps) and build many reports and dashboards themselves.
By the February 2016 Gartner Magic Quadrant, the picture had flipped: Tableau, Qlik and Microsoft (Power BI) were the leaders, and the classic enterprise vendors had slid toward the visionaries and niche players.
Enterprise BI vs Self-Service BI
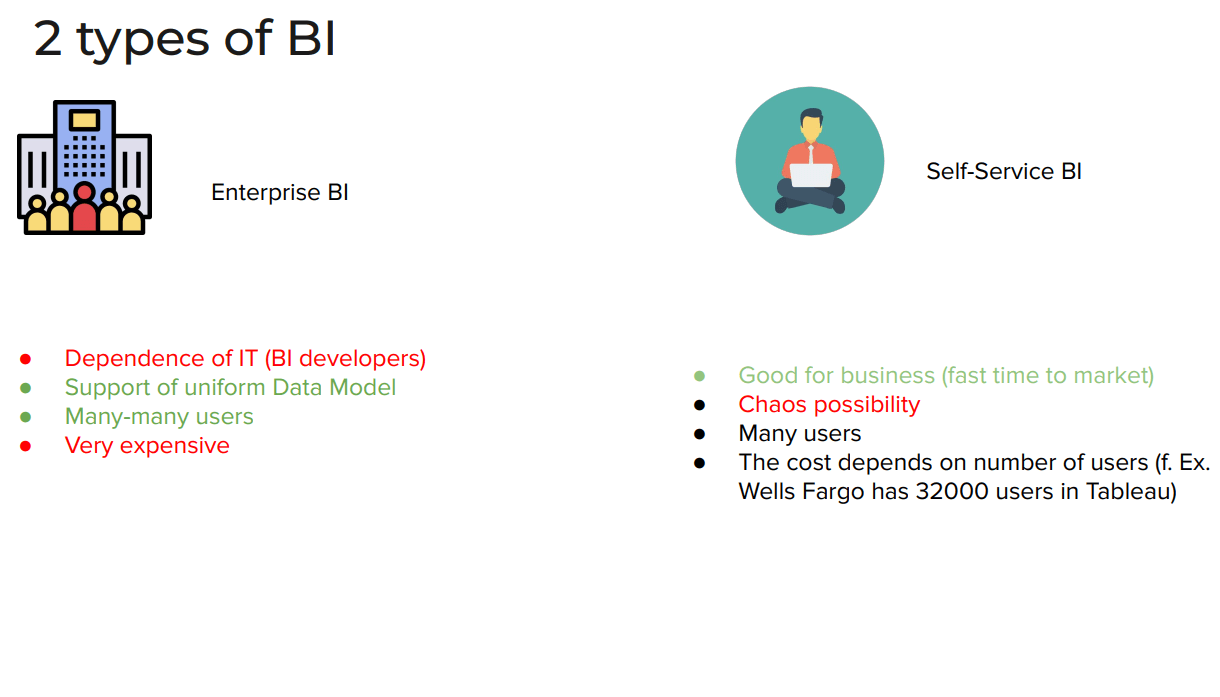
| Enterprise BI | Self-Service BI | |
|---|---|---|
| Who builds reports | BI developers (dependence on IT) ❌ | Business users and analysts: fast time to market ✅ |
| Data model | One uniform data model ✅ | Many sources, risk of chaos ❌ |
| Users | Many, many users ✅ | Many users |
| Cost | Very expensive ❌ | Depends on the number of users (e.g. Wells Fargo has 32,000 Tableau users) |
Enterprise BI buys governance and consistency at the cost of speed and price. Self-Service BI is fast and flexible, but without discipline it is easy to end up with everyone’s own version of the truth. That is why modern teams add a governed layer (a well-modeled warehouse or a semantic layer) under their self-service tools.
This lesson is for members only
Join Surfalytics to unlock all 8 lessons in this module, plus every module, project, mock interview, and the private community.
7-day free trial · Cancel any time