What You Get Inside
Data Job Market Insights
Support & Real Tools
to Get Hired in Data
- Discord-based system for job search, tech prep, interviews, and networking — no fluff, just what you need to stay on track.
- Resume roasting and mock interviews with real feedback to help you stand out and feel confident.
- Weekly progress check-ins to stay consistent and accountable.
Surfalytics gives you structure, support, and clarity in your Data job hunt — no matter if you're aiming for Canada, the US, or Europe. It’s a real-world navigation system, not just another course.
Oh, and yes — there’s a course tooWhy Surfalytics Members Actually Get Hired
Real interview preparation
Practice with mock interviews, analyze real interview recordings, and learn the exact questions companies are asking today.
Resume that gets callbacks
Get expert feedback through resume roasting sessions and add Canadian internship experience to beat ATS filters and stand out.
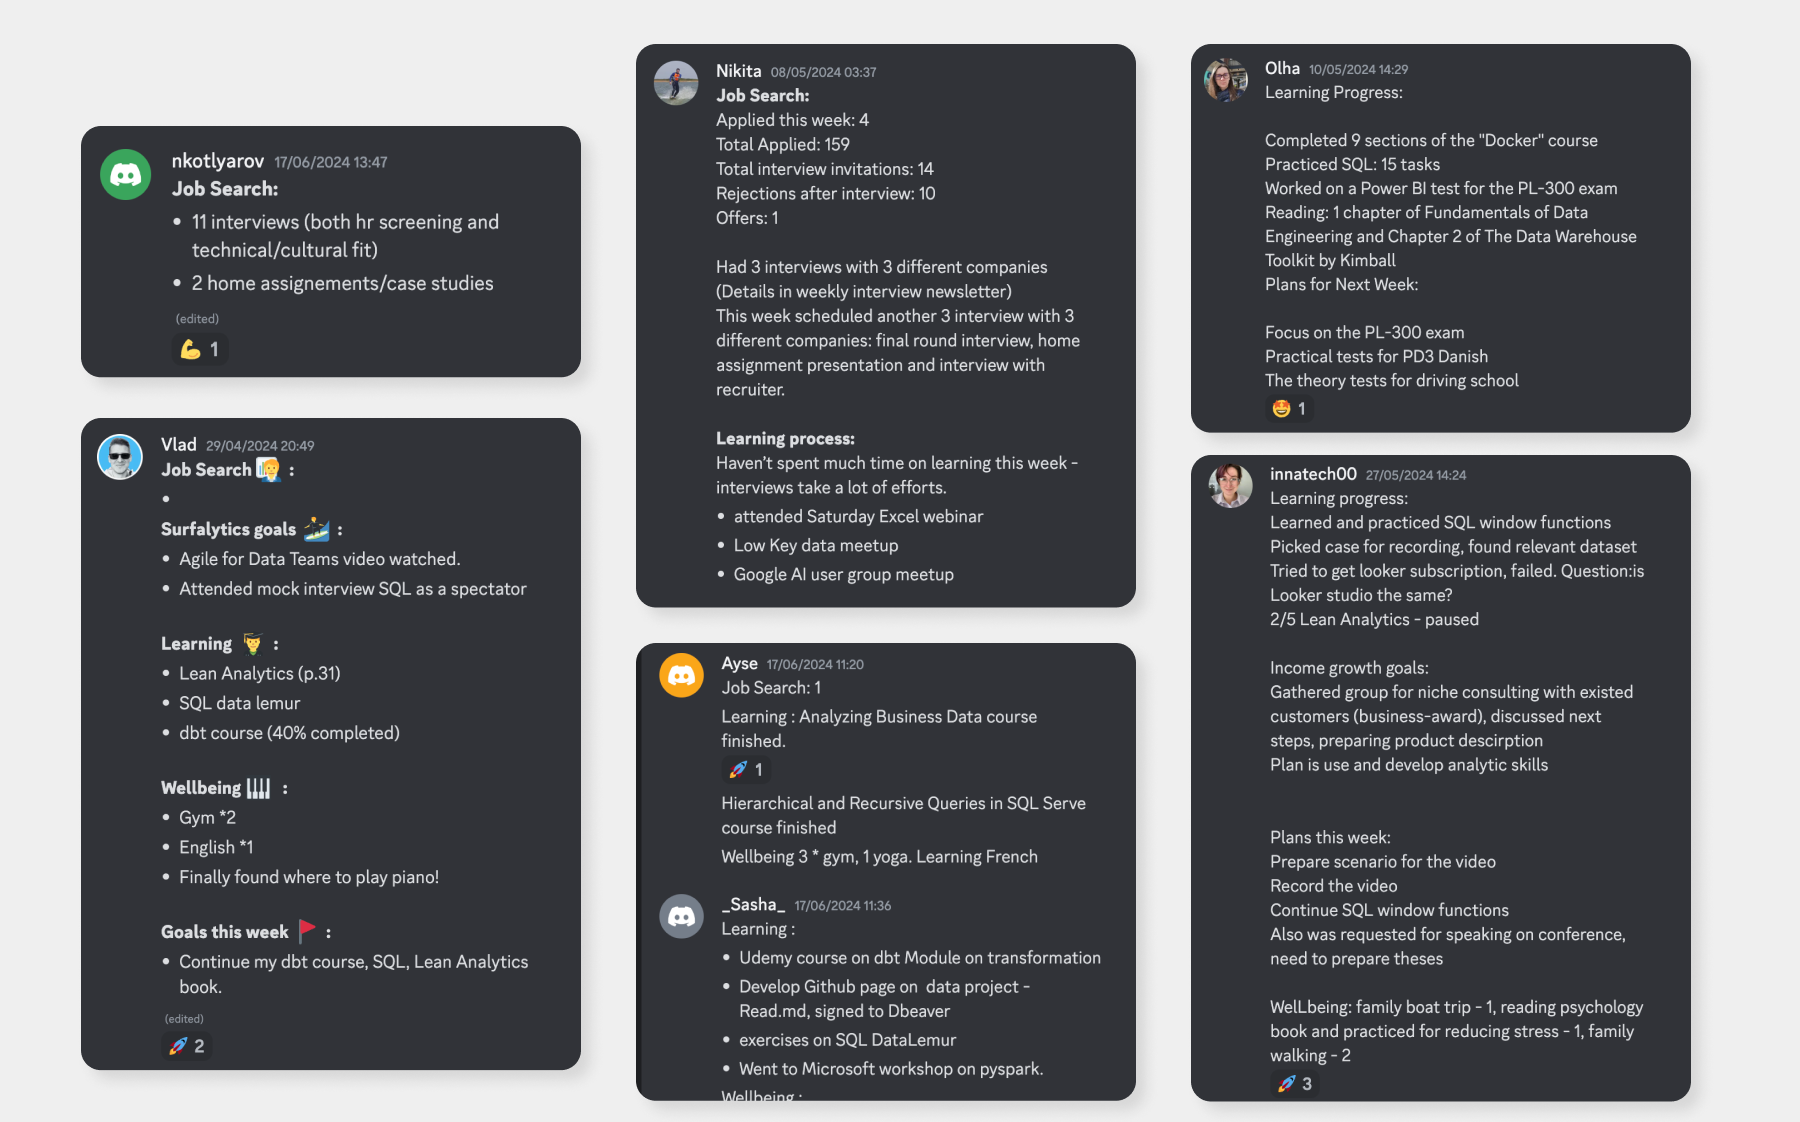
Weekly progress tracking
Stay consistent and on track — report your wins, learnings, and goals every week, and stay motivated by others doing the same.
Insights from the Data job market
Follow a 13-module course designed by an active industry expert. Build hands-on projects with modern tools, ready to showcase at interviews.
Personalized career advice
Get feedback and guidance for your specific background, goals, and region — no more one-size-fits-all advice.
Community that has your back
Curated job and event channels, insider info, peers who understand what you’re going through. You're not doing this alone.
What it’s like inside Surfalytics
You learn with people on the same mission
Surfalytics is built around shared progress — every week members post wins, learnings, and next steps. You’re not just consuming info — you're growing alongside others aiming for the same goal.
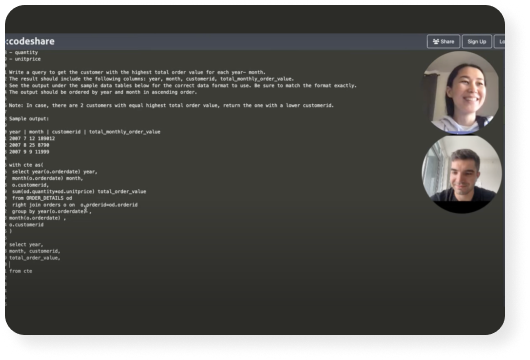
Real projects, not toy examples
Every month you get access to hands-on Data projects using modern tools — fast to complete, easy to add to your resume, and perfect for interview conversations.
Career guidance that’s actually hands-on
We run mock interviews with real questions, roast your resume until it’s recruiter-ready, and give practical tips tailored to your background and goals. Everything is designed to help you move forward — faster and with clarity.
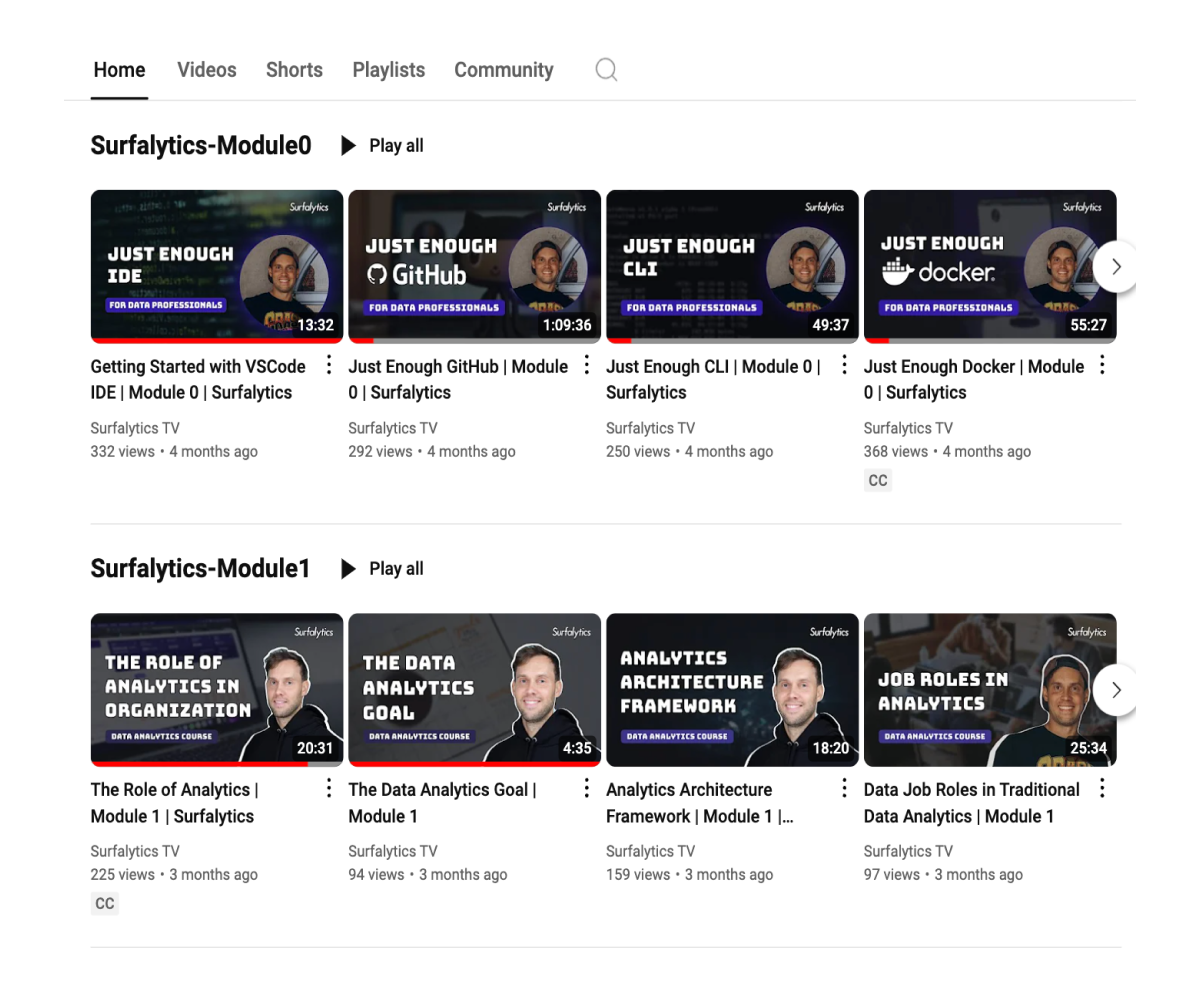
Check our mock interviews on YouTube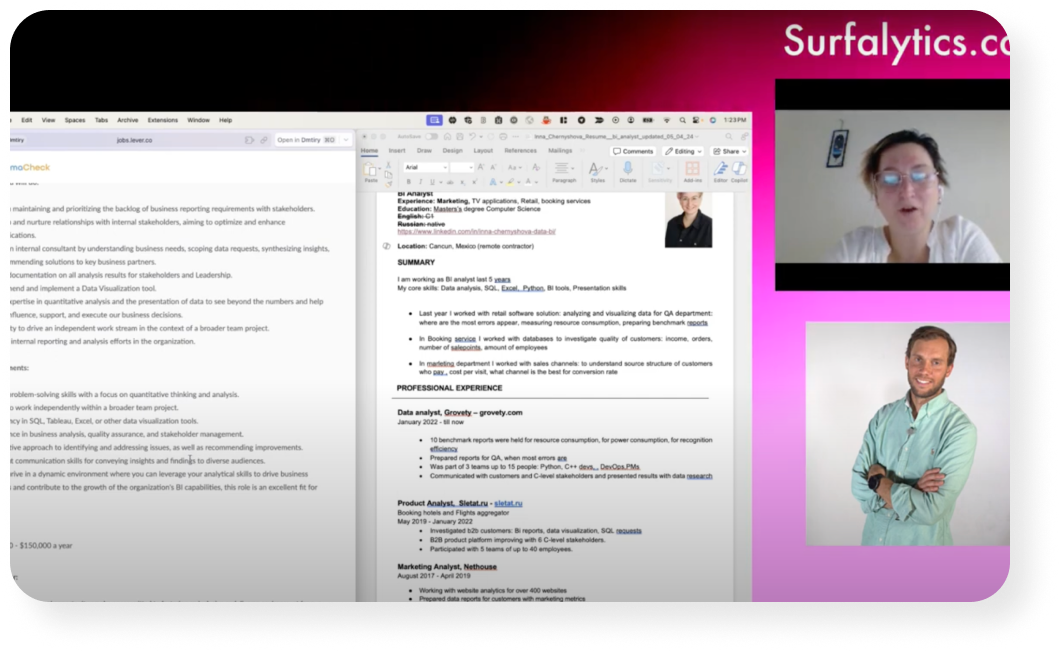
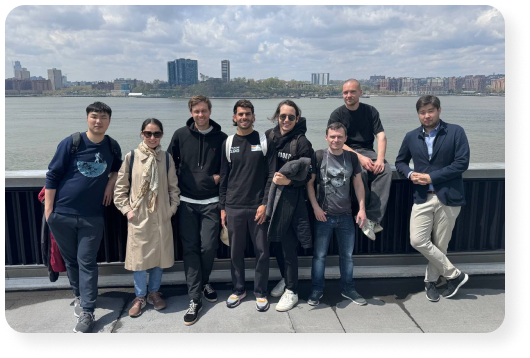
Real people with real energy and support.
Job hunting can feel lonely — but inside Surfalytics, you’re surrounded by people who get it. Share your doubts, celebrate your wins, and stay accountable with others on the same journey. It’s more than a server — it’s your support system when things get hard and motivation runs low.
Get Real Support
Job-Ready Skills
Get Hired in Data
Your membership gives you access to mock interview sessions, resume reviews, weekly progress check-ins, a practical orientation course, and a curated Discord community — designed to help you stay focused and move closer to your first Data job.
Membership Pricing
$100 / month
or $500 / year
We prefer motivation over money. Apply for a 50% Motivation Grant — for those who are serious about their career, but need a little help getting started
- Free-7 day trial
- AMA sessions about jobs, skills, and strategy
- Data projects to build your portfolio
- Resume feedback, mock interviews, career planning
- Weekly progress check-ins to keep you accountable


Check our success stories
Master your data skills with our Data Analytics and Engineering Course
Course Curriculum
Data Analytics and BI
1. What, Why, Who, How Analytics?
2. Databases and SQL.
3. Business Intelligence with Tableau, Power BI, and Looker.
Data Engineering - Gentle
4. ETL Developer with dbt (ELT), Pentaho DI (classic UI ETL), and dimensional modelling.
5. Cloud Computing fundamentals with AWS and Azure.
6. Cloud Data Warehouse with Redshift, Synapse, Snowflake, BigQuery, Clickhouse.
Data Engineering - Hardcore
7. Apache Spark and Databricks.
8. Hadoop on top of EMR, HDInsights with Hive.
9. Data Lake and Lakehouse with Trino, Athena, Synapse Serverless, and Databricks (Delta Lake and Spark Serverless).
10. Streaming with Apache Kafka, Apache Flink, Kinesis, Spark Structured Streaming, and Delta Streaming. (advanced)
11. ML fundamentals for Data Engineers. (advanced)
Best practices
12. Best practices for Data Engineers with DevOps and SoftSkills.
Mentoring and Coaching Services Pricing
Hourly mentorship
$200
1 hour session, that you can use to:
- Talk over your case and ask relevant questions
- Get a strategy to scale total compensation
- Ask questions about immigration to North America and many more
If you don’t know where to start, this session is right for you.
Adjusting Career Trajectory
$500
most popular
Learn from the experienced engineer who was there and can help you to choose the optimal career path depending on your needs - total compensation, company tier, work/life balance, career growth.
This package includes two 1-hour sessions and a tailored learning plan to achieve result.
- Assessment of your current situation and goal setting
- Learning path to succeed
End-to-end Coaching
$999
+30% of your first net salary
From your current circumstances towards the offer. Even if you don’t have prior experience, it doesn’t matter. All we need is consistency, motivation, and hard work.
This package includes the 5 consultations, your assessment, tailored study plan and Surfalytics community membership.

Frequently Asked Questions
What is the purpose of community?
Our community is dedicated to empowering data professionals by providing a platform for networking, sharing knowledge, and accessing exclusive resources. Whether you're a beginner or an expert, our community aims to support your growth in the field of data analytics and engineering.
Who can join Surfalytics community?
Anyone with an interest in data analytics and engineering is welcome to join. Our members range from students and enthusiasts to seasoned professionals working in various industries.
What are the benefits of joining the community?
Members enjoy a variety of benefits, including:
- Access to exclusive webinars and live Q&A sessions with industry experts.
- Opportunities to collaborate on projects and participate in community-driven research.
- A members-only newsletter featuring the latest industry news and opportunities.
- Networking opportunities with peers and leaders in the field.
Can I get an invoice for my purchase?
Yes, we can provide an invoice upon request. Please contact our support team support@surfalytics.com with your order details, and we’ll generate and send the invoice to you.
How can I become a member?
To join our community, please complete the membership purchase process. After your purchase is confirmed, we will send you an email with further instructions, including how to access our exclusive Discord channel.
Can I cancel my membership?
Yes, you can cancel your membership at any time. To cancel a membership, please contact our support team support@surfalytics.com.
How can members contribute to the community?
Members can contribute in various ways, including:
- Sharing their knowledge by writing articles or conducting webinars.
- Participating in peer mentoring programs.
- Volunteering for community outreach or event planning.
- Providing feedback and suggestions to improve the community.
Who can I contact if I have more questions?
For any additional inquiries, please reach out to our support team at support@surfalytics.com. We are here to help and ensure you have the best experience in our community.